Analytics & Reports
BillManager provides a dedicated Analytics page with visual charts to help you understand your financial patterns.
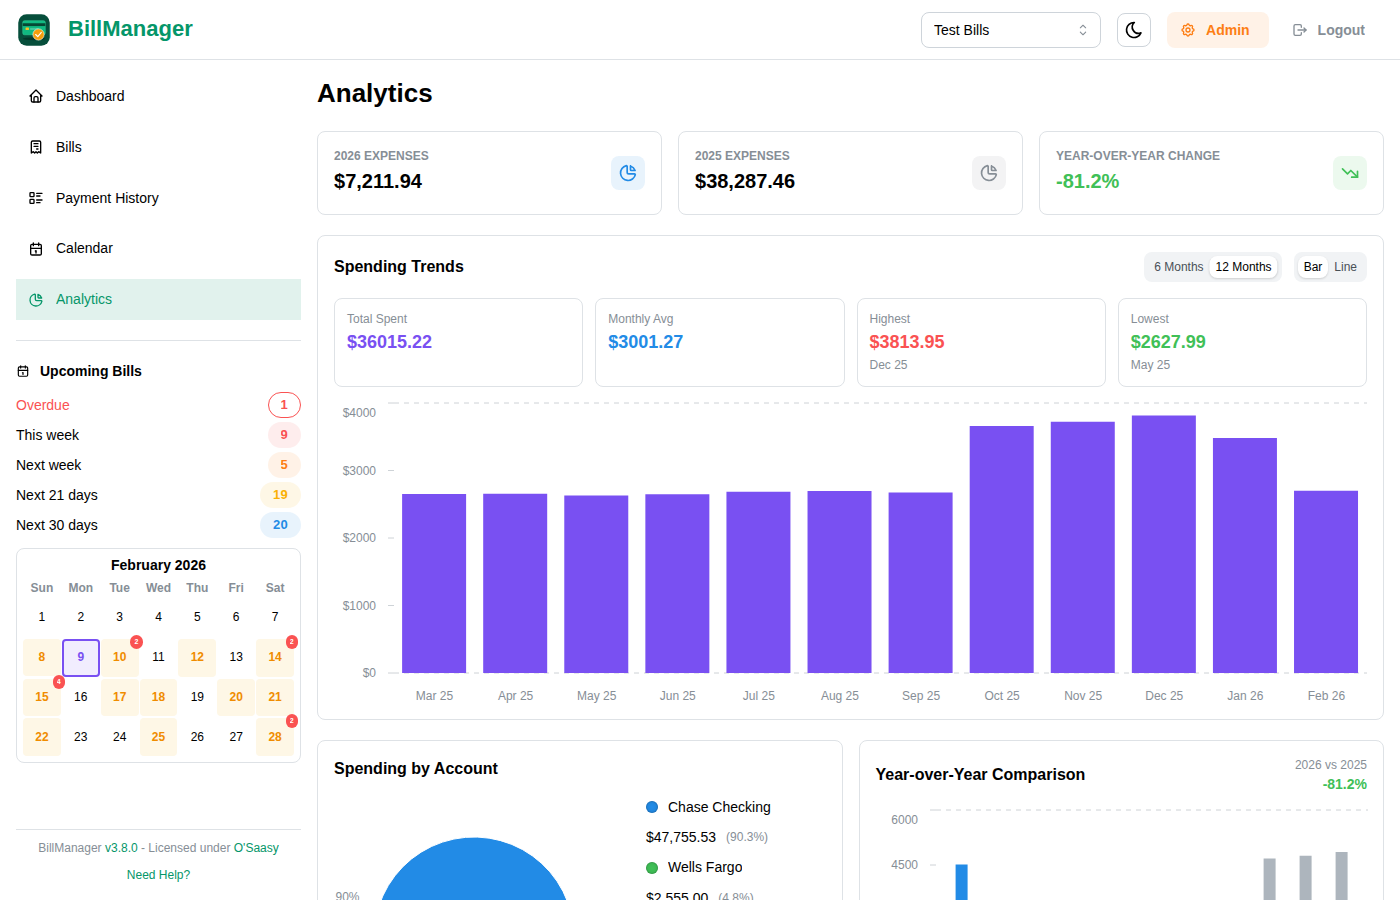
Accessing Analytics
Click Analytics in the sidebar navigation to open the full Analytics page.
Spending Trends
The Spending Trends chart shows your payment history over time as a bar or line chart.
What It Shows
The chart displays your financial activity per month, helping you:
- See spending patterns over time
- Identify high and low spending months
- Track payment consistency
- View income from shared bill payments
Income from Shared Bills
When you share bills and recipients pay their portion, those payments appear as income in your trends:
- Green bars show income/deposits (including shared payments received)
- Red bars show expenses/bills paid
- Net effect gives you an accurate picture of your actual costs
For example, if you pay $1200 rent but split it with a roommate who pays $600, your trends will show:
- $1200 expense when you pay rent
- $600 income when your roommate pays their share
- Net cost of $600 for the month
Chart Options
- Time Range: View last 6 months or 12 months
- Chart Type: Switch between Bar chart and Line chart
Spending by Account
A pie chart breaking down your spending by account category. This helps you see which areas (housing, utilities, subscriptions, etc.) make up the largest share of your expenses.
Year-over-Year Comparison
Compare your spending between the current year and the previous year side by side. This chart makes it easy to spot trends, seasonal patterns, and whether your expenses are growing or shrinking over time.
Yearly Summary
Summary cards at the bottom of the Analytics page show annual totals:
- Total Expenses - Sum of all bill payments for the year
- Total Deposits - Sum of all income/deposits for the year
- Net - The difference between deposits and expenses
Payment History
Access the complete Payment History from the sidebar:
- Click Payments in the sidebar
- View all recorded payments
- Search and filter payments
- Export as CSV or PDF
Export Options
- CSV - Raw data for spreadsheet analysis
- PDF - Formatted report for printing or sharing
Tips for Financial Insights
- Track Consistently - Record all payments promptly for accurate trends
- Use Accounts - Categorize bills for better organization
- Review Monthly - Check the Analytics page each month to spot changes early
- Set Up All Bills - Include even small recurring charges
- Include Income - Track deposits for a complete picture